|
Cheat Engine The Official Site of Cheat Engine
|
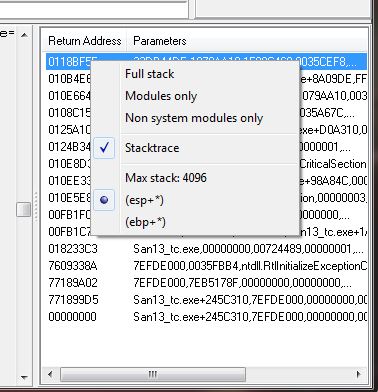
| "Full stack" and "Stack trace"? |
  |
| Author | Message | |||||||||||||||||
|---|---|---|---|---|---|---|---|---|---|---|---|---|---|---|---|---|---|---|
| Dr.Disrespect Grandmaster Cheater Joined: 17 Feb 2016 Posts: 526 |
|
|||||||||||||||||
| mgostIH Expert Cheater  Reputation: 3 Reputation: 3Joined: 01 Jan 2016 Posts: 159 |
|
|||||||||||||||||
| ParkourPenguin I post too much  Reputation: 155 Reputation: 155Joined: 06 Jul 2014 Posts: 4770 |
|
|||||||||||||||||
| Dr.Disrespect Grandmaster Cheater Joined: 17 Feb 2016 Posts: 526 |
|
|||||||||||||||||
|
|
All times are GMT - 6 Hours |
|
|
You cannot post new topics in this forum You cannot reply to topics in this forum You cannot edit your posts in this forum You cannot delete your posts in this forum You cannot vote in polls in this forum You cannot attach files in this forum You can download files in this forum |
Powered by phpBB © 2001, 2005 phpBB Group
CE Wiki IRC (#CEF) Twitter
Third party websites