| View previous topic :: View next topic |
| Author |
Message |
eax.qbyte
Advanced Cheater
![]() Reputation: 3 Reputation: 3
Joined: 25 Jun 2011
Posts: 59
Location: CEDisasmView
|
 Posted: Mon Apr 08, 2013 10:47 pm Post subject: how to find last jmp [addr] Posted: Mon Apr 08, 2013 10:47 pm Post subject: how to find last jmp [addr] |
 |
|
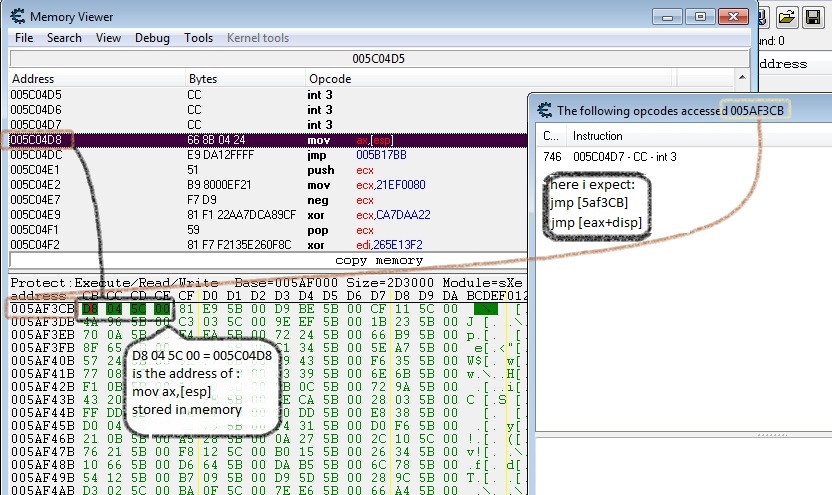
Hi. i got a hard situation. at least for me. and try to explain it:
there is a code section which my program jumps there:
| Code: | int 3
int 3
mov ax,[esp] // this intsruction is where app jumps
...
..
. |
but i cant find where is the jmp/call instruction. and i tell you why:
-i'm sure it is not a call, because return address{[esp]} is no code.
-it is not a normal jmp 0xaddr instruction because desect code doesn't detect any thing.
-it is a (jmp/jne/jz/...)j** [address] this is our last possibility left.
i also searched memory for the address that is being jumped into, and found something in an unaligned memory and placed a break point for access break there but it gives me the { int 3 } instruction right before the jmp target instruction. and i'm stuck here 
| Description: |
| may be more understandable by picture |
|
| Filesize: |
188.73 KB |
| Viewed: |
10186 Time(s) |
|
_________________
My special thanx to Cheat Engine and its developers. It helps me do the hard and boring but valuable process of understanding the code, easily and with fun.
Last edited by eax.qbyte on Mon Apr 08, 2013 11:22 pm; edited 1 time in total |
|
| Back to top |
|
 |
Mohsen
Advanced Cheater
![]() Reputation: 1 Reputation: 1
Joined: 04 Apr 2013
Posts: 69
Location: PE
|
| Posted: Mon Apr 08, 2013 11:19 pm Post subject: |
|
|
Take a look into stack or set break point in stack there might be useful data.
One more guess, Memory view -> Search -> Assembly code and input following pattern
j* YOUR_ADDRESS
That should find any jump to there.
If this is a call set a break point on mov ax,[esp] and when you reached it do Debug -> Execute till return.
|
|
| Back to top |
|
|
eax.qbyte
Advanced Cheater
![]() Reputation: 3 Reputation: 3
Joined: 25 Jun 2011
Posts: 59
Location: CEDisasmView
|
| Posted: Mon Apr 08, 2013 11:33 pm Post subject: |
|
|
I tried this one too.
but looks like it is not the direct numeric address
and it should be:
j* [reg32+disp]
and this type of general search probably is not supported in assembly code search.and i cant find any beginning of a structure around to guess the displacement.
but about break point in stack! that could lead in to a solution.
also if some body has another common suggestion for this special situation that could happen a lot in reversing it is appreciated to tell me.
Thank you.
_________________
My special thanx to Cheat Engine and its developers. It helps me do the hard and boring but valuable process of understanding the code, easily and with fun. |
|
| Back to top |
|
|
Dark Byte
Site Admin
 Reputation: 474 Reputation: 474
Joined: 09 May 2003
Posts: 25952
Location: The netherlands
|
| Posted: Tue Apr 09, 2013 2:56 am Post subject: |
|
|
If you where using xp with kernelmode debugging these lua functions could help:
| Code: |
debug_setLastBranchRecording(boolean): When set the Kernel debugger will try to record the last branch(es) taken before a breakpoint happens
debug_getMaxLastBranchRecord() : Returns the maximum branch record your cpu can store (-1 if none)
debug_getLastBranchRecord(index): Returns the value of the Last Branch Record at the given index (when handling a breakpoint)
|
It would tell you where the last jumps came from
Also, you can do a break and trace an data access as well. Select the bytes , rightclick, data breakpoint, break and trace.
And have you checked the code at 5B17BB ?
_________________
Tools give you results. Knowledge gives you control.
Like my help? Join me on Patreon so i can keep helping
Last edited by Dark Byte on Tue Apr 09, 2013 3:17 am; edited 1 time in total |
|
| Back to top |
|
|
TsTg
Master Cheater
 Reputation: 5 Reputation: 5
Joined: 12 Dec 2012
Posts: 340
Location: Somewhere....
|
| Posted: Tue Apr 09, 2013 3:02 am Post subject: |
|
|
One more solution, if you know where the routine at 5C04D8 ends, check the RET command there, and try placing it here:
5C04D8 --->RET or RET XX
the RET should take you to the address that used the last recorded CALL command, try it, might work.
|
|
| Back to top |
|
|
Mohsen
Advanced Cheater
![]() Reputation: 1 Reputation: 1
Joined: 04 Apr 2013
Posts: 69
Location: PE
|
| Posted: Tue Apr 09, 2013 3:14 am Post subject: |
|
|
| TsTg wrote: |
the RET should take you to the address that used the last recorded CALL command, try it, might work. |
TsTg it's same as
If this is a call set a break point on mov ax,[esp] and when you reached it do Debug -> Execute till return.
| Dark Byte wrote: | If you where using xp with kernelmode debugging these lua functions could help:
| Code: |
debug_setLastBranchRecording(boolean):
debug_getMaxLastBranchRecord() :
debug_getLastBranchRecord(index):
|
|
Dark_Byte could you implement these for Win 7 ? xp is quite old and unsupported.
|
|
| Back to top |
|
|
TsTg
Master Cheater
Reputation: 5
Joined: 12 Dec 2012
Posts: 340
Location: Somewhere....
|
| Posted: Tue Apr 09, 2013 3:33 am Post subject: |
|
|
| Mohsen wrote: |
TsTg it's same as
If this is a call set a break point on mov ax,[esp] and when you reached it do Debug -> Execute till return.
|
@Mohsen, yes they're the same i already know that
|
|
| Back to top |
|
|
eax.qbyte
Advanced Cheater
![]() Reputation: 3 Reputation: 3
Joined: 25 Jun 2011
Posts: 59
Location: CEDisasmView
|
| Posted: Tue Apr 09, 2013 8:28 am Post subject: |
|
|
Tnx. very nice of you.
I could use the recommeded solutions but none of them completely solved the problem.
but why?
at that position of the code:
- stack is really unstable and I couldn't use it's data to discover some thing.
- the function was strangely long or they have used some anti debugger mechanism to misdirect the debugger into ultimate loops(CE broke and traced 10,000 lines of code without a ret instruction or call a function)
- unfortunately I'm not using XP windows. kernel mode debug could be the only way to certain answers.
but finally the registers status that i forgot to add it in the first post(i'm sry about not giving you enough information) had some helpful data which i used it a lot
| Code: | EAX 000000D3
EBX 00000008
ECX 00000001
EDX 005AF2D3
ESI 0066A9B9
EDI 005AF2BF
ESP 0018D66A
EIP 005C04DC |
yes if there is a jmp [reg32+disp] instruction which jumps here it means one of the registers contains some pointer(with or without offset) to the address of opcode stored in memory and it means that pointer has been accessed before the jump instruction, and if i find it, i nearly have found the desired jump. it should be like this:
| Code: | someAddr+xx0: mov reg32,opcPointer // instruction what accesses opcPointer
someAddr+xx1: jmp [reg32+disp]
int3
jTarAddr+0000: mov ax,[esp] // breakpoint here; opcPointer value is still in reg32
jTarAddr+xxxx: jmp 005B17BB // i checked this. it was nothing special
===========================
memory. . . . . . . . . . . . . .value
opcPointer+disp. . . . . . .jTarAddr+0000
|
_________________
My special thanx to Cheat Engine and its developers. It helps me do the hard and boring but valuable process of understanding the code, easily and with fun.
Last edited by eax.qbyte on Wed Apr 10, 2013 5:52 am; edited 1 time in total |
|
| Back to top |
|
|
TsTg
Master Cheater
Reputation: 5
Joined: 12 Dec 2012
Posts: 340
Location: Somewhere....
|
| Posted: Tue Apr 09, 2013 8:05 pm Post subject: |
|
|
Other solution that might help, try stealthedit plugin (Version 2)
Link: http://www.szemelyesintegracio.hu/cheats/41-game-hacking-articles/419-stealthedit
Then stealthedit the address 5C04D8, but first, enable scan for integrity checking (acutally were are not scanning for that, but this will give us who accessed 5C04D8 or any address within the same memory page), might get useful addresses for your problem.
|
|
| Back to top |
|
|
|

